Product research is essential and cannot be done at random. Category research only determines whether a market is worth entering, while product research identifies which specific product to sell. The purpose of product research is not to find the “hottest” product, but to select one that you can execute now, compete effectively with, and manage with controllable risk.
1. Reasons for Product Research
1.1. Identify “worthwhile” products and avoid blindly following trends
Many sellers fail to generate sustainable profits because they see a promising category and randomly pick a product to list based on intuition. The problem is that a good category does not guarantee a good product. Even in a high-demand, stable, and moderately competitive category, many products may still be unprofitable. For example, the category may contain best-selling items monopolized by top sellers, established products with thousands of reviews, or standardized items with little profit margin due to intense price competition. Focusing only on the category without proper product selection can still lead to losses.
1.2. Learn from competitors’ strengths while avoiding their weaknesses
Successful products are often not entirely new or original. They are usually market-validated items that have not yet been fully optimized. The key to product research is to analyze competitors to leverage their advantages while avoiding their weaknesses. By observing top-selling products, you can summarize common features, understand consumer preferences, and identify overlooked issues or unmet needs in the market. This data-driven analysis enhances your market sensitivity, allows trend forecasting, and provides clear guidance for product optimization and operational strategies
2. Step-by-Step Instructions
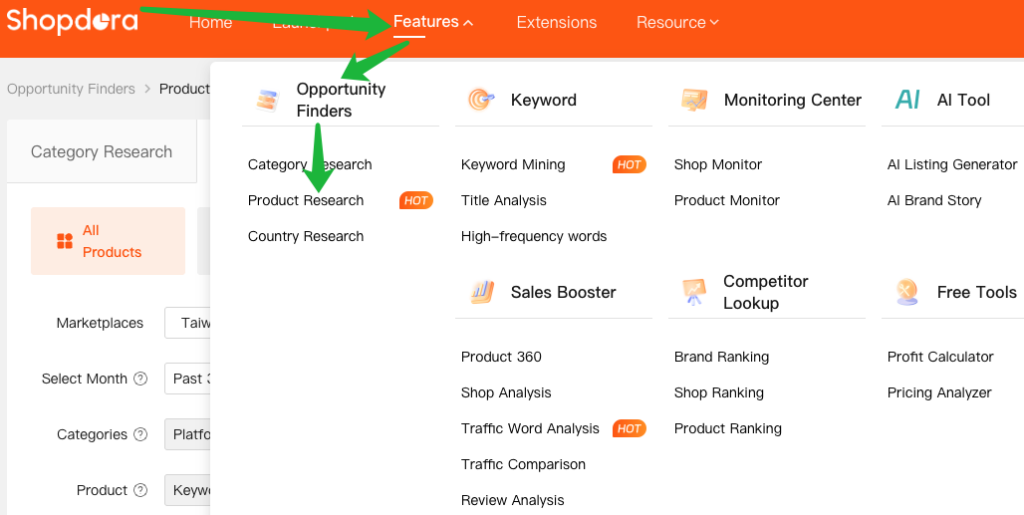
- Navigate to Opportunity Finder →Product Research
3. The Five Core Modules of Product Research
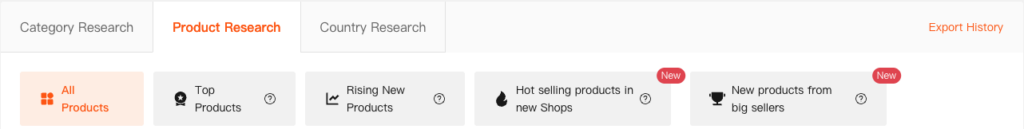
- Shopdora’s Product Research includes five key filtering tabs:
- All Products
- Top Products
- Rising New Products
- Hot selling products in new Shops
- New products from big sellers
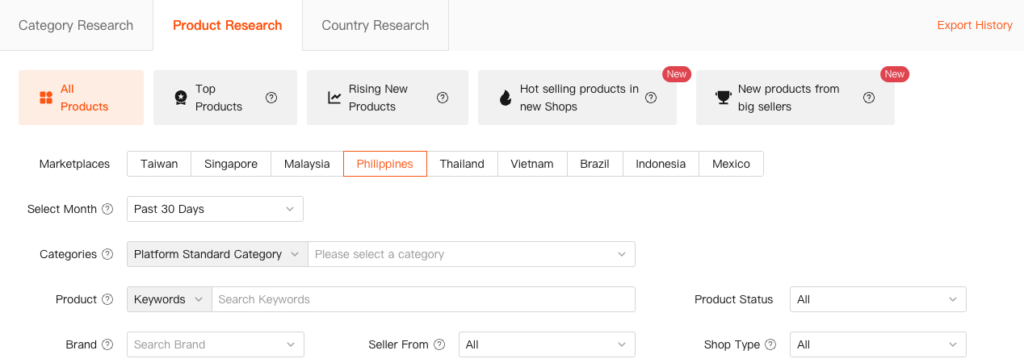
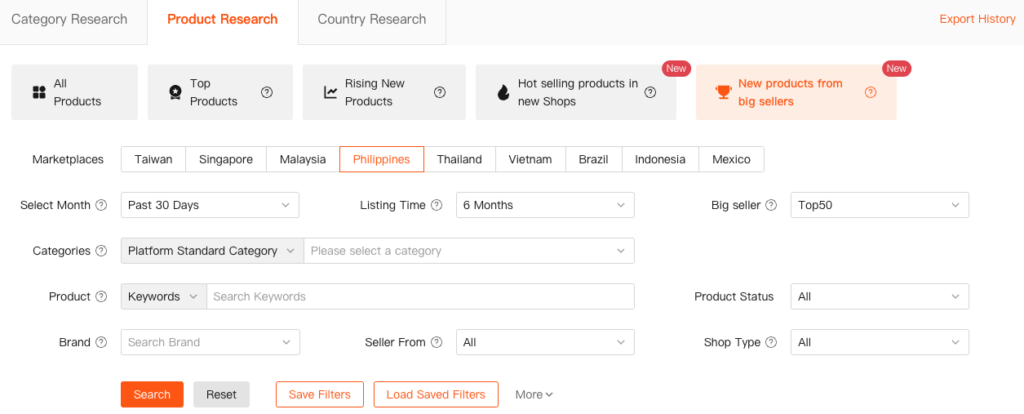
3.1 All Products
All Products covers product data across all Shopee categories, providing comprehensive datasets that allow users to apply custom filters, analyze product performance, and develop effective product selection strategies.
| Filter | Description | Options/Details |
|---|---|---|
| Marketplace | Supports 9 major markets | Taiwan, Singapore, Malaysia, Philippines, Thailand, Vietnam, Brazil, Indonesia, Mexico |
| Select Month | Choose the time frame for the data analysis. | Past 30 Days, Monthly |
| Categories | Filter products by Platform Standard Category or Custom Category. | Platform Standard Category: Official Shopee categories, up to 5 levels deep. Custom Category: User-defined categories for personalized analysis. |
| Product | Find specific products by entering keywords. Using brand names or core nouns is recommended for accuracy. | Text input (e.g., brand name, product noun) |
| Product Status | Filter products based on their current visibility and availability in the store. | All, Listed, Unlisted, Deleted |
| Brand | Specify a brand name (supports fuzzy search) or filter by brand status. | Brand status:No Brand, All Brands |
| Seller From | Filter based on the shipping origin of the seller. | All, Local, Overseas |
| Shop Type | Filter by the seller’s official status on the Shopee platform. | Regular: Standard shops. Preferred: Top-performing shops recognized by Shopee. Mall: Invitation-only platform for brand owners and authorized distributors. All: All shops. |
💡 Pro Tip: How to Find a Specific Shop or Product
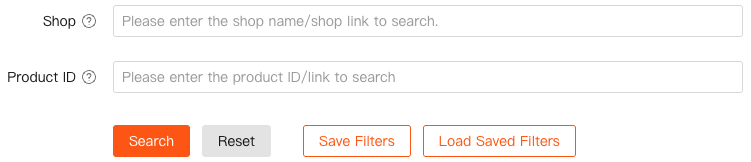
- To find a shop: Simply enter the shop’s name or paste its shop’s URL into the search bar.
- To find a product: Use the product’s URL or the Product ID.
- Remember to select the corresponding marketplace when using a Product ID for an accurate search!
3.2 Top Products
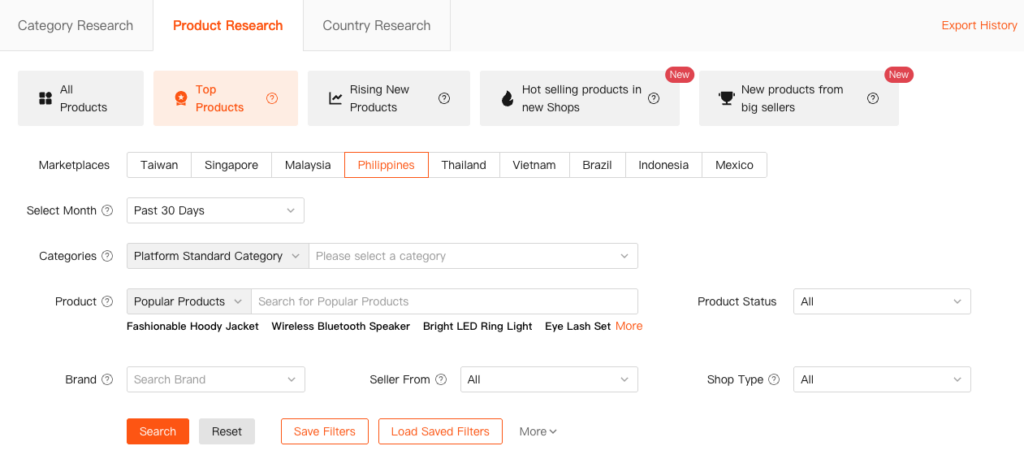
This module showcases the best-selling items in each category, sorted by their monthly sales volume. Products that show a significant rise in the rankings are particularly noteworthy.
Why is Monthly Sales Volume a Key Metric?
Sales volume represents actual, completed transactions, making it the most direct indicator of real market demand.
- High Monthly Sales = Strong Market Demand: A higher sales volume indicates that the product effectively meets a strong consumer need.
- The “High Demand + High Interest” Profile: These top-performing products have been validated by the market.
By analyzing the Top Products list, sellers can quickly identify proven product types and market trends. Timing your entry based on this data allows you to seize market opportunities and cultivate your next blockbuster product.
3.3 Rising New Products
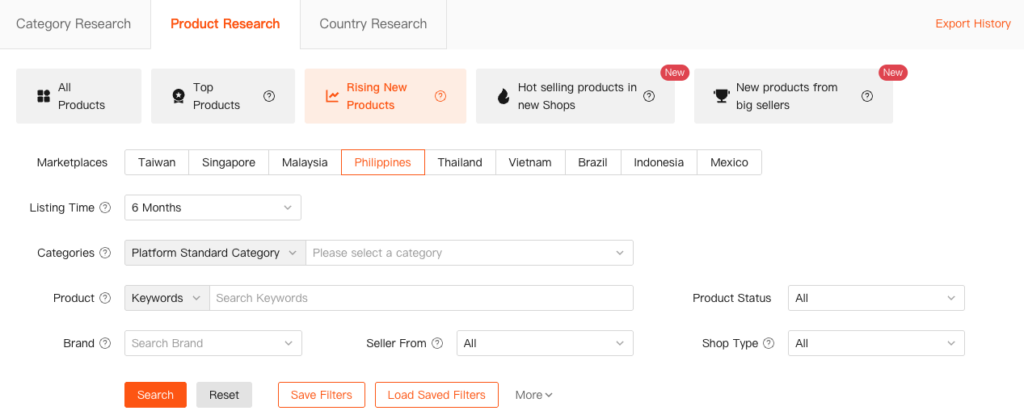
This module identifies high-potential new products that meet the following criteria:
- Rising New Products.
- Ranked within the top 1,000 in its respective categories.
- Listing Time (selectable): No Limit / 7 Days / 15 Days / 1 Month / 3 Months / 6 Months / 1 Year / 2 Years
Why Focus on Rising New Products?
Successful shop management requires more than just reacting to current market data; it demands the foresight to predict future trends. By continuously monitoring the sales and ranking changes of these rising stars, you can uncover critical market intelligence:
- Which new products are rapidly gaining market traction?
- What product types are emerging as the next growth drivers?
This tool empowers sellers to move beyond a reactive stance. It allows you to proactively identify and invest in high-potential products, stay ahead of market shifts, and avoid being left behind.
3.4 Hot Selling Products in New Shops
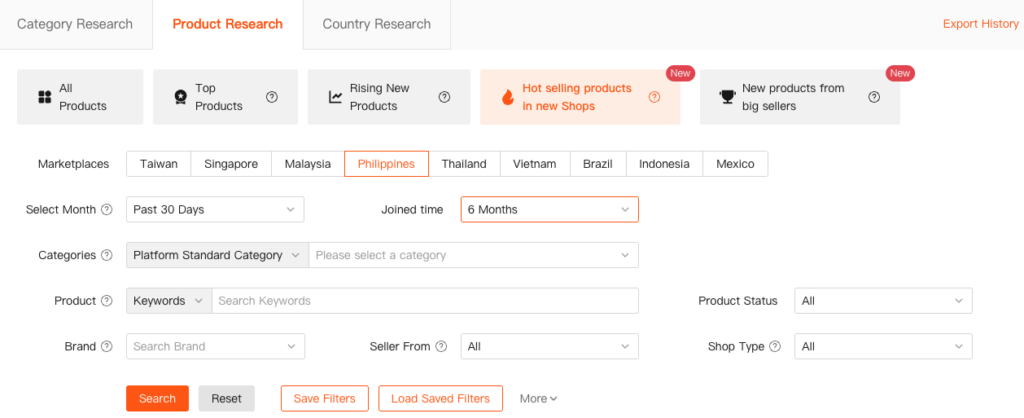
This module helps discover high-sales-momentum products from new stores.
- Default criteria: Shops ≤ 6 months old + Monthly sales > 100
- Customizable filters:
- Shop Age (selectable): 1 Month / 2 Months / 3 Months / 4 Months / 5 Months / 6 Months
- Monthly Sales: Adjust to “> 200” (or other thresholds) for higher-performing items
Why Are These Products Significant?
These products are particularly valuable for new and small-to-medium-sized sellers because they demonstrate that it is possible to achieve consistent sales even with limited operational history and resources.
3.5 New Products from Big Sellers
This module allows you to track the latest product launches from top-performing sellers. You can filter to see products listed within the last 6 months by the Top 10, Top 30, or Top 50 sellers in any given category.
Why Track New Products from Big Sellers?
The product selection and launch strategies of top sellers often reflect a more mature and data-driven understanding of the market. By analyzing their new listings, you can:
- Anticipate Future Trends: Identify product categories that are poised for significant growth before they become mainstream.
- Gain an Early Mover Advantage: Strategically “follow the sell” while these products are still in their early launch phase, giving you a head start.
- Align with Market Rhythms: Quickly adapt to the prevailing market trends and position your store to capture emerging opportunities.
4. Metric Dimension Explanation Area
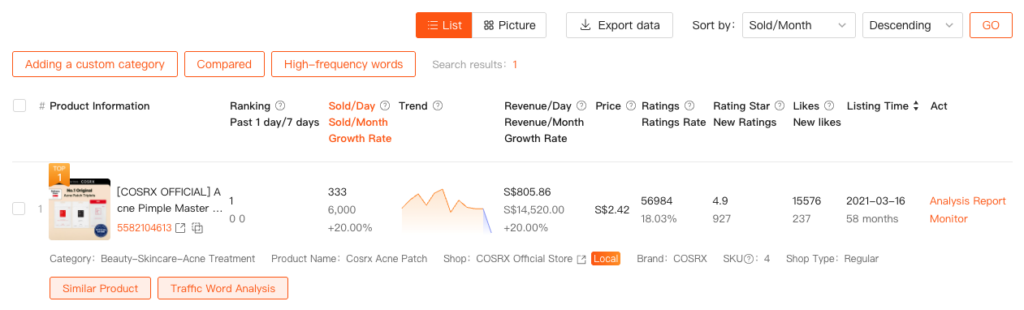
4.1 Key Metrics Explained
| Metric | Explanation |
|---|---|
| Ranking (Past 1 day / 7 days) | Ranking: The latest ranking of the product within its category. DPast 1 day/7 daysownward: The ranking change over the past 1 day and 7 days. |
| Sold/Day, Sold/Month, Growth Rate | Monthly Sales Volume: Total units sold within the selected time period. If the time period is the past 30 days, it represents sales in the last 30 days; if a specific month is selected, it reflects that calendar month’s sales. Growth Rate: Percentage change compared to the previous period. |
| Trend | Visualizes the sales trend within the selected time frame. Note: a value of 0 may indicate missing data, not necessarily zero sales. |
| Revenue/Day, Revenue/Month, Growth Rate | Revenue/Month: Total revenue generated during the selected period. Growth Rate: Percentage change compared to the previous period. |
| Price | Current product price. |
| Ratings / Review Rate | Ratings: Latest total number of product reviews. Review Rate: Number of reviews for the product divided by the latest cumulative sales volume. |
| Rating Star / New Ratings | Rating Star: Latest star rating. New Ratings: The number of new ratings added within the selected time period. |
| Likes / New Likes | Likes: Latest total count of product likes. New Likes: The number of newly added likes within the selected period. |
| Listing Time | The product’s shelf time, based on its listing date. |
4.2. Analysis Report
4.3. Monitor
4.4. Adding a custom category
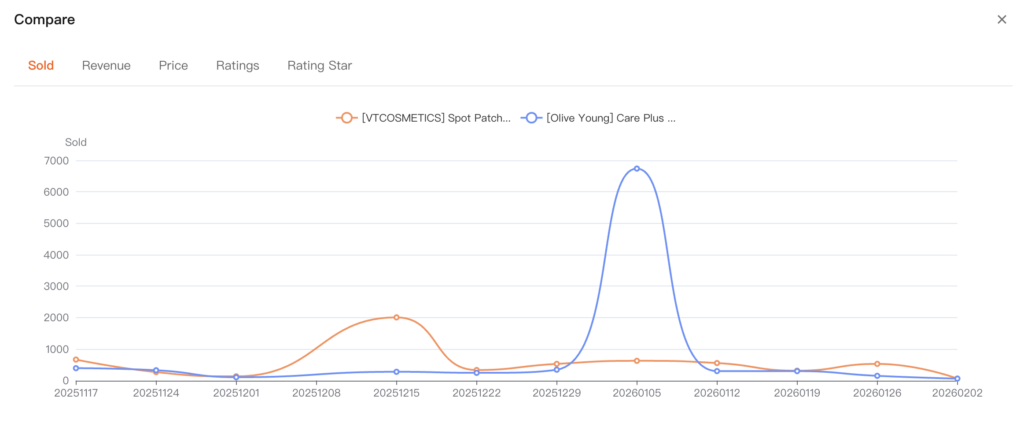
4.5. Compared
Multiple products can be selected for comparison. The chart provides a clear visual comparison of changes across five key metrics: Sold, Revenue, Price, Ratings, and Rating Star.
4.6. High-frequency words
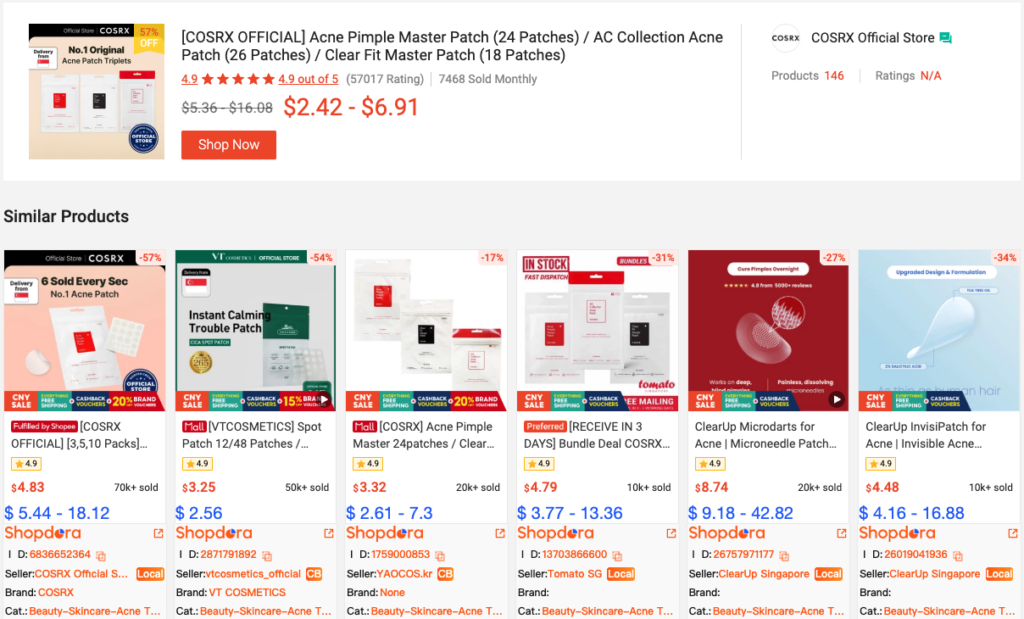
4.7. Similar Product
This section displays the performance of similar products.