In Shopee operations, relying solely on platform data limits your ability to fully understand market dynamics. Shop Monitor helps you track competitor sales trends, new product launches, and product structure in real time. This enables faster decision-making, timely strategy adjustments, and reduces the risk of missed opportunities or sustained losses.This guide walks you through how to use Shopdora’s Shop Monitor for efficient and data-driven shop management.
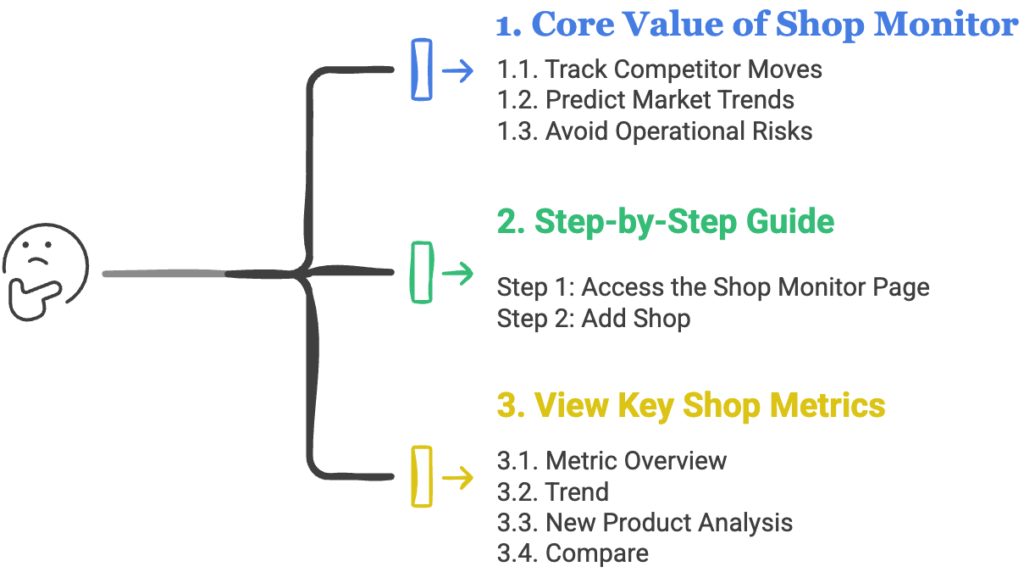
1. Core Value of Shop Monitor
1.1. Track Competitor Moves
Monitor competitors’ new product launches, best-selling items, and category focus.
→ Use this to plan your own product launches and stay ahead in the market.
1.2. Predict Market Trends
Compare multiple shops to identify industry-wide patterns.
→ Inform your product selection, inventory planning, and marketing timing with real data.
1.3. Avoid Operational Risks
Spot performance gaps between your shop and top competitors.
→ Prevent inefficient spending and improve resource allocation.
2. Step-by-Step Guide
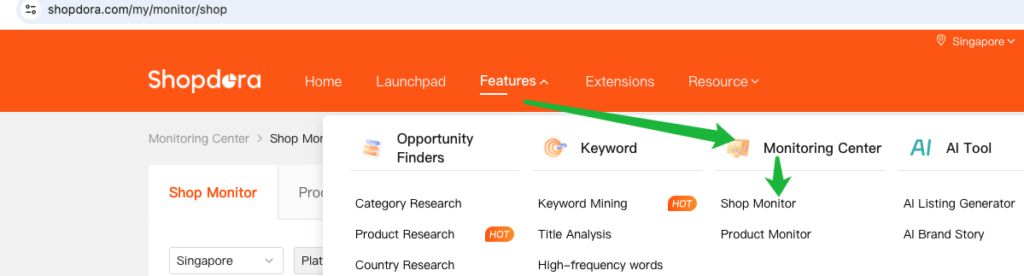
Step 1: Access the Shop Monitor Page
- Navigate to Monitoring Center > Shop Monitor.
Step 2: Add Shop
To start tracking, add the target Shopee shop:
- Copy the Shopee shop Link
- Paste the link → Click Submit.
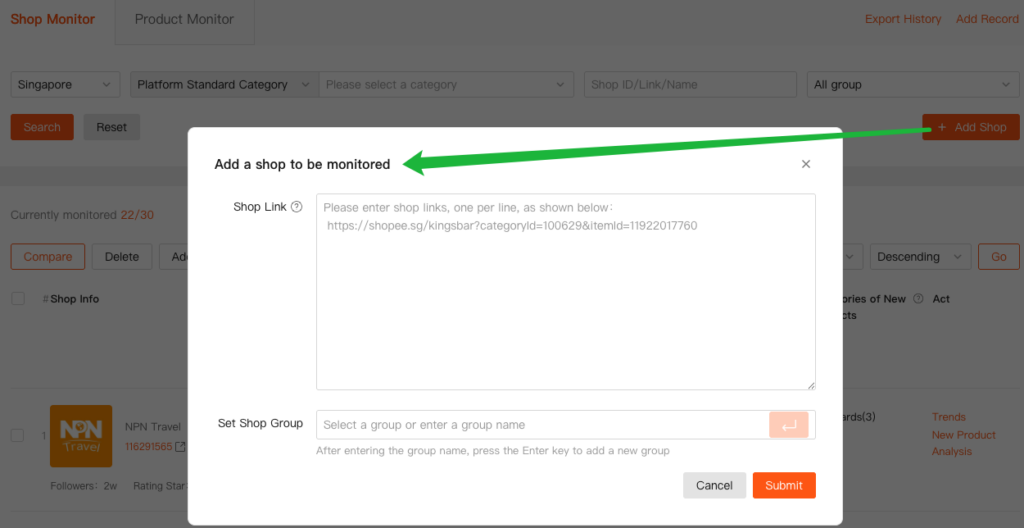
🔍 Note: Only verified links are accepted. Ensure the shop is publicly accessible.
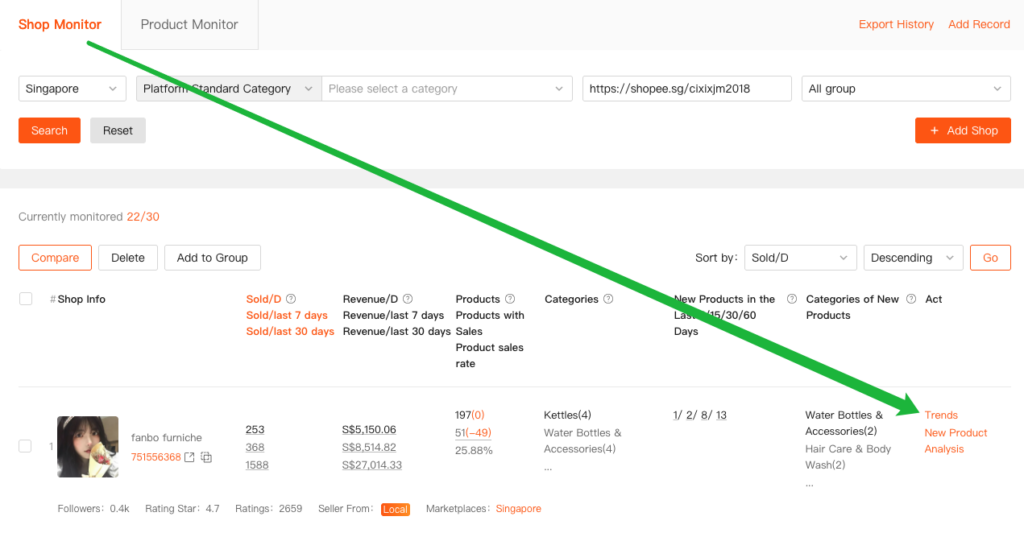
3. View Key Shop Metrics
Once added, click any shop in the list to see its detailed performance.
3.1. Metric Overview(Key Columns Explained📊)
| Sold/D Sold/last 7 days Sold/last 30 days | Revenue/D Revenue/last 7 days Revenue/last 30 days | Products Products with Sales Product sales rate | Categories | New Products in the Last 7/15/30/60 Days | Categories of New Products |
|---|
3.2. Trend
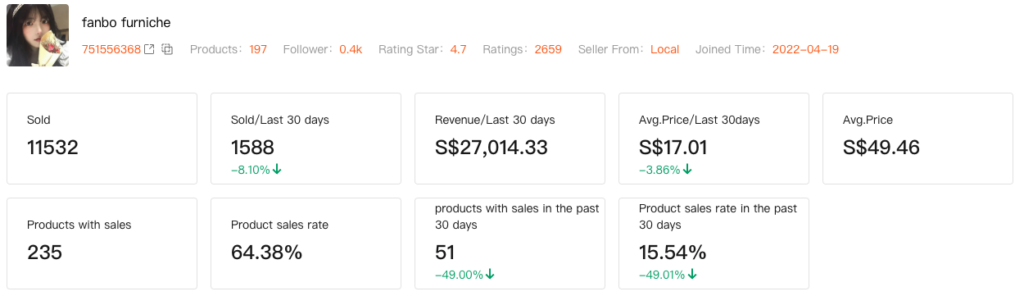
3.2.1 Store Monitoring Overview
Access the store overview to quickly understand the shop’s overall performance, including sales, products, pricing, and engagement metrics.
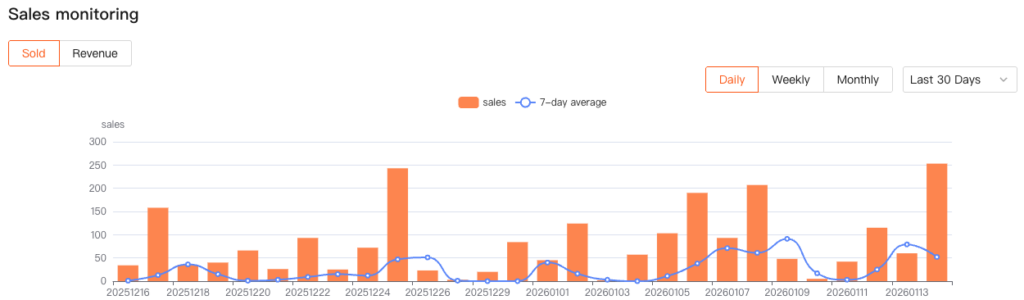
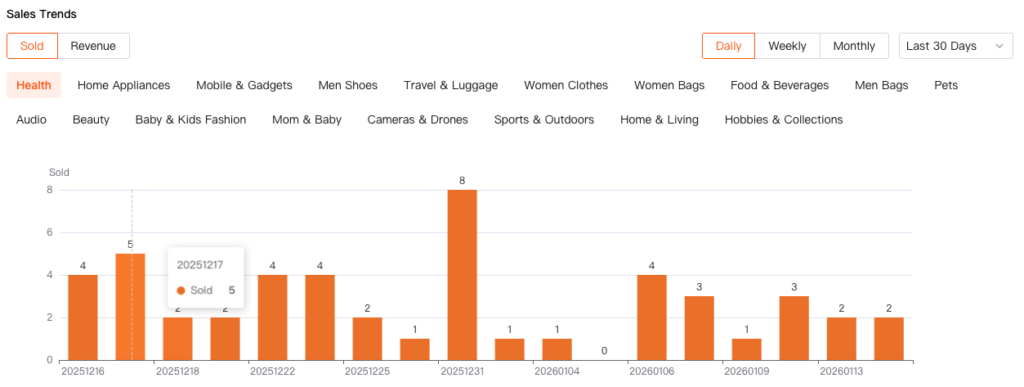
3.2.2 Sales monitoring
The Sales Trend chart provides a clear view of the store’s sales performance over time, helping you identify growth patterns, declines, and abnormal fluctuations.
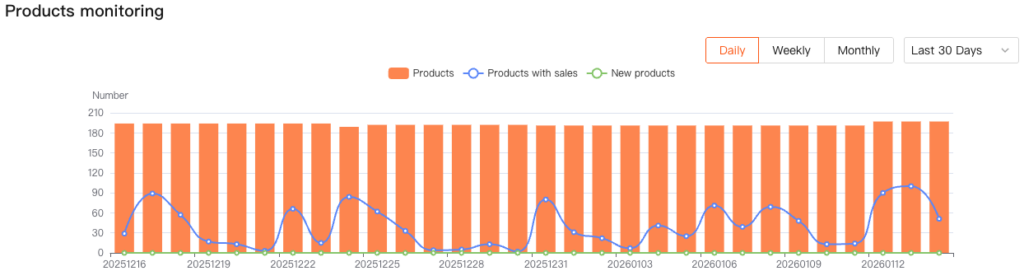
3.2.3 Products monitoring
The Products Monitoring chart helps you track the store’s product launch pace and overall sales activity.
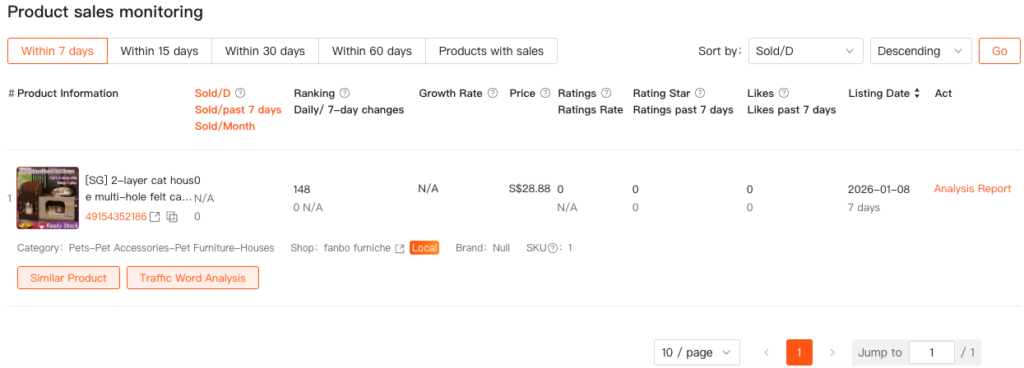
3.2.4 Product sales monitoring
Displays detailed data for products in the store, supporting multi-dimensional filtering and sorting.
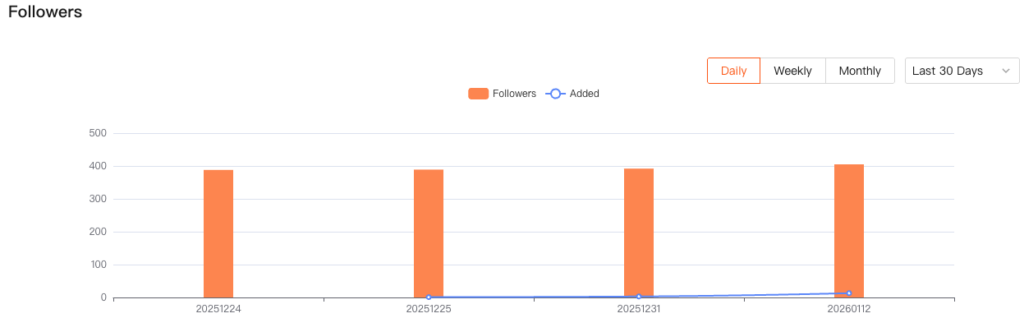
3.2.5 Followers
The Follower Trend chart visualizes changes in follower count over time, reflecting the store’s brand appeal and marketing effectiveness.
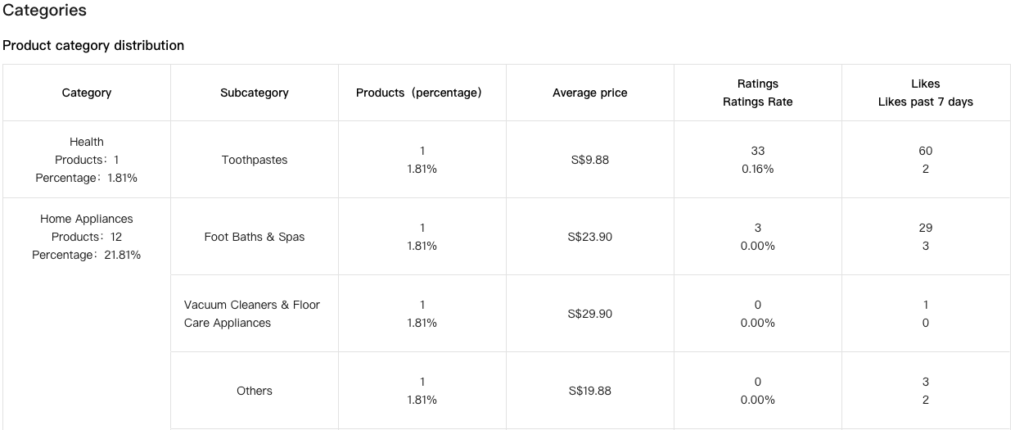
3.2.6 Categories
Clearly shows the store’s primary product categories, helping you quickly understand its business focus.
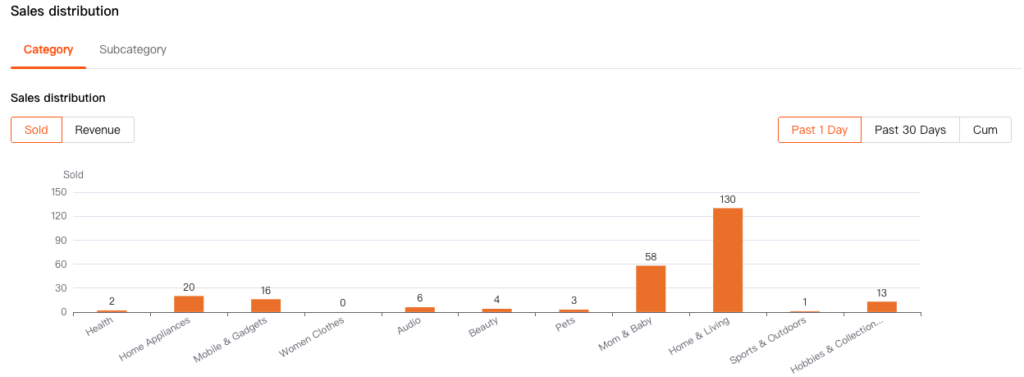
3.2.7 Sales distribution
The category Sales Distribution chart helps identify the store’s category structure and highlights which subcategories contribute the most to overall sales.
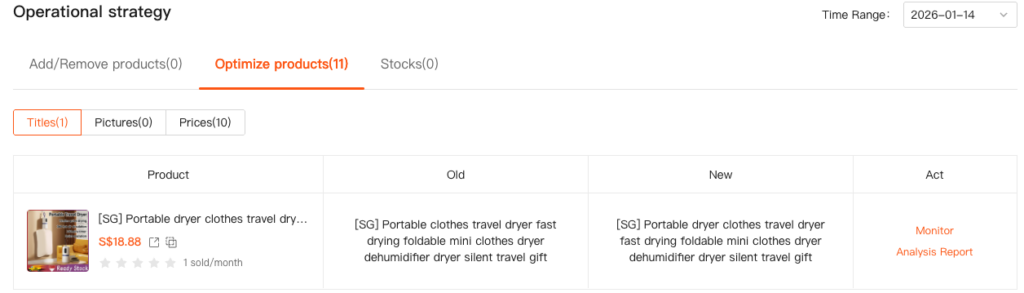
3.2.8 Operational strategy
The Operational Strategy module tracks recent optimization actions taken by the store, such as product adjustments or operational changes. This helps you evaluate the effectiveness of these actions and continuously improve operational efficiency.
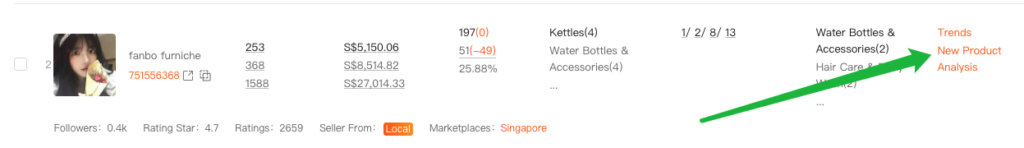
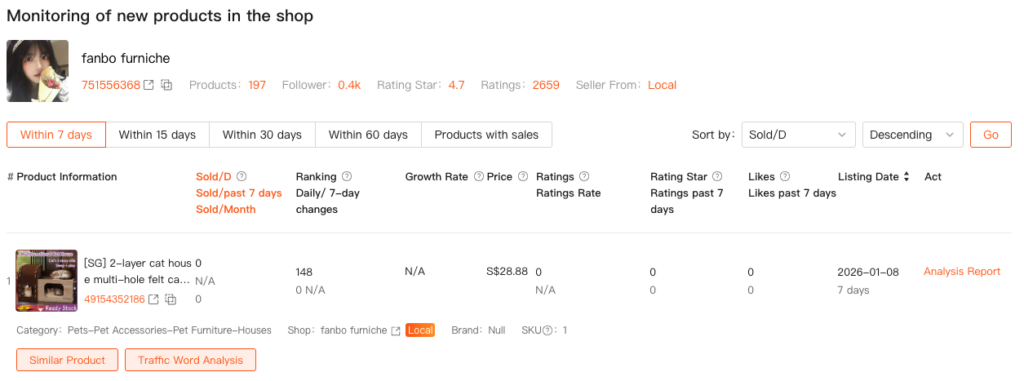
3.3. New Product Analysis
The New Product Analysis feature allows you to track the performance of newly listed products in target stores, helping you identify potential bestsellers and emerging market trends.
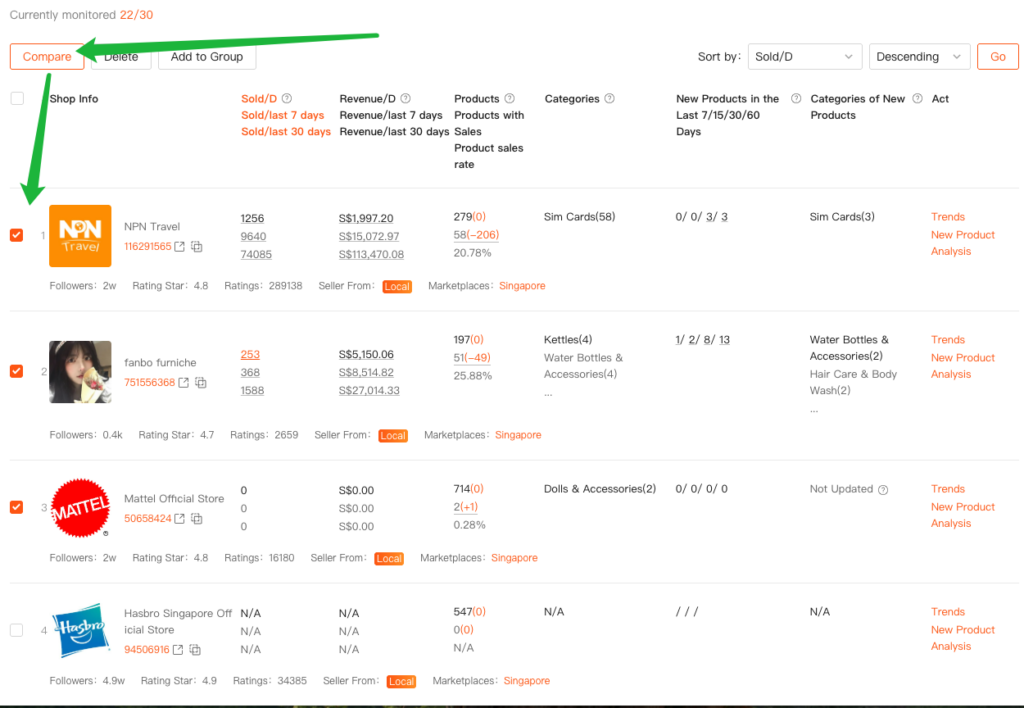
3.4. Compare
- On the Store Monitor page, select multiple added stores.
- Click the Compare button at the top.
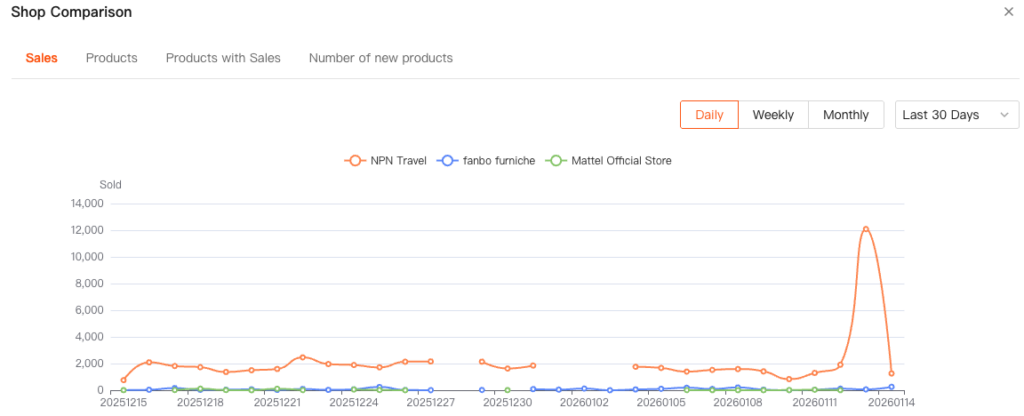
The Store Comparison feature allows you to directly compare the sales performance of multiple stores over the same time period, helping you identify market trends and evaluate your competitive position.